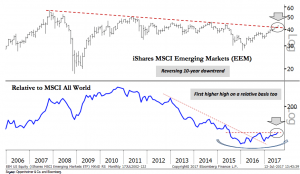
Oppenheimer’s head of technical analysis Ari Wald calls this “our chart of the week, month and potentially year,” explaining that it “not only carries significance for the future direction of EEM’s trend—we think higher—but also for the cyclical recovery as well because broadening global participation remains a focal point to our outlook.”

As you can see, the iShares MSCI Emerging Markets EEM, -0.14% which has woefully underperformed the S&P 500 SPX, -0.11% over the past decade, is breaking out of a 10-year downtrend and is also making a higher high relative to an MSCI global index MSCI, +0.44%
The Reformed Broker blog’s Josh Brown also highlighted the chart in a post over the weekend, saying it has “the potential to become very big news for investors with global allocations and traders looking for the next mega-trend.”
Brown points out that people will say the recent push in emerging markets is solely driven by the unexpected weakness in the U.S. dollar USDEUR, -0.4187%
His response: “So? It isn’t enough to make money now? You need to like the explanation for it too? What planet are you from?”
Brown added that “market moves can only ever be explained after the fact, and usually not very well.” True enough.


